 BubbleMarkets
Software to Identify Market Momentum With Moving Average Systems

Market momentum measures how an asset’s price changes over a chosen period. Software to identify market momentum can display that change alongside moving averages, which help show whether the broader price trend is rising or falling. A positive reading indicates upward momentum; a negative reading indicates downward momentum.
A sharp price move can seem to tell the whole story, but it doesn’t. Momentum readings, trend direction, and the measurement period each add context to what the chart shows.
This article explains how momentum is calculated and how moving averages, indicators such as RSI and MACD, and possible ignition signals can help you interpret price action. It also shows how timeframes shape the picture, so you can assess what a momentum tool reveals without treating an indicator as a prediction.
Key Takeaways
- Compare oscillator readings with price direction to distinguish a developing trend from a short-lived move.
- Read ignition signals as evidence of changing momentum, then assess whether price action and trend indicators support the move.
- Use moving-average crossovers and slope to compare short-term direction with the broader trend.
- Set scanner criteria around a defined lookback and return threshold, then rank results to surface relative strength.
- Use market bubble maps to scan asset groups visually and spot where movement is concentrated.
Momentum oscillators and trend indicators
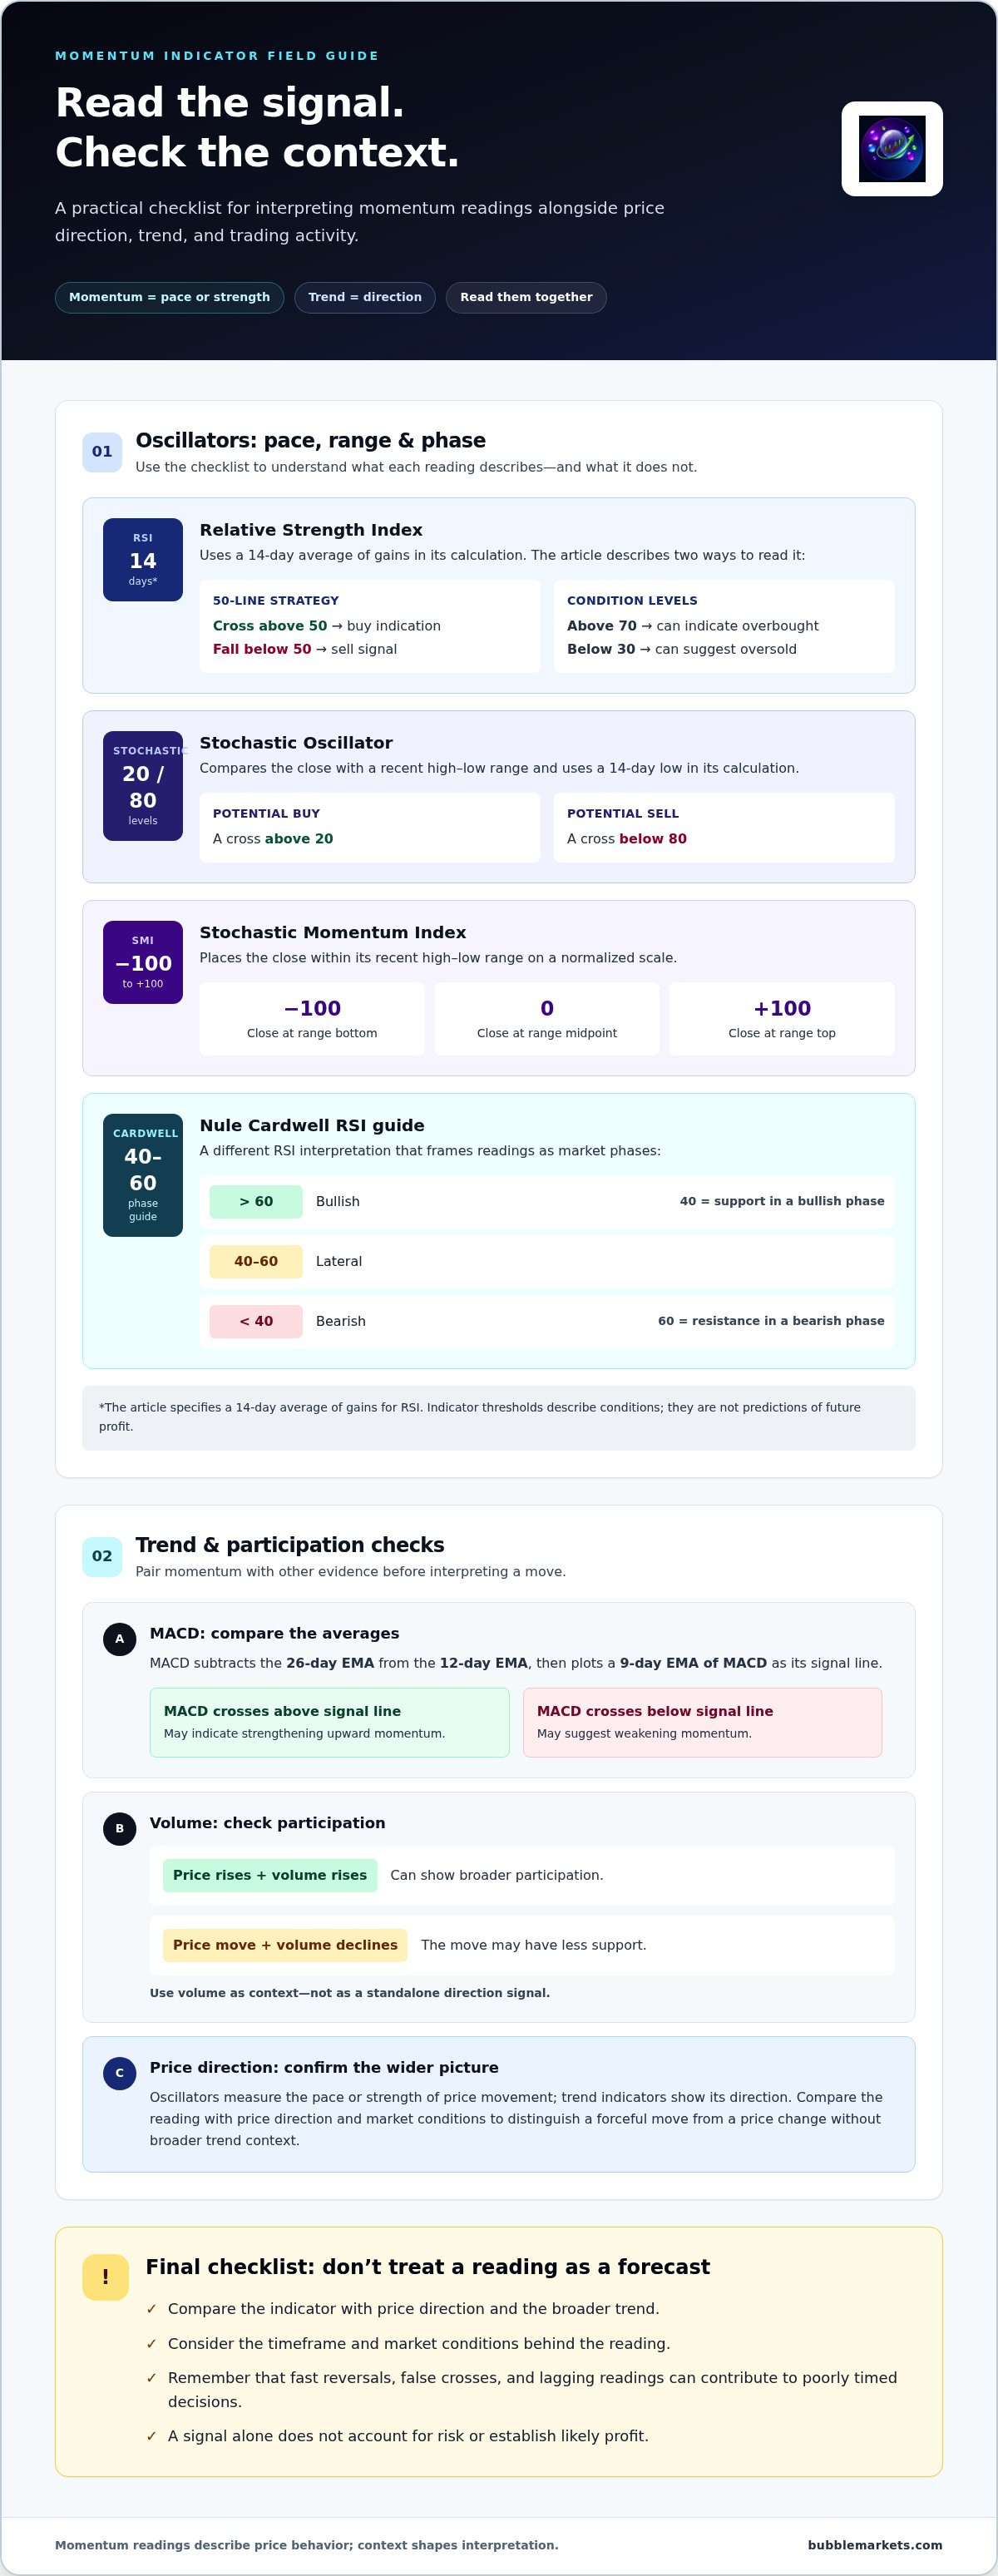
Momentum oscillators measure the pace or strength of price movement; trend indicators show its direction. Reading both helps distinguish a forceful move from a price change without broader trend context.
Technical Momentum Indicators
Technical momentum indicators convert recent price behavior into readings that help assess direction and possible changes in pace. The Relative Strength Index (RSI) uses a 14-day average of gains in its calculation; one strategy treats a cross above 50 as a buy indication and a fall below 50 as a sell signal. Readings above 70 can indicate overbought conditions, while readings below 30 can suggest oversold conditions. These thresholds describe conditions, not future profit. The Stochastic Oscillator compares the close with a recent high-low range and uses a 14-day low in its calculation. One strategy signals a potential buy when it crosses above 20 and a potential sell when it crosses below 80. Compare each reading with price direction and market conditions before interpreting its signal.
MACD and Volume-Based Measures
Moving Average Convergence Divergence (MACD) compares two exponential moving averages to show changes in momentum. It subtracts a 26-day exponential moving average from a 12-day exponential moving average, then plots a 9-day EMA of MACD as its signal line. When MACD crosses above that line, the move may indicate strengthening upward momentum; a cross below may suggest weakening momentum. Volume-based measures add a different dimension: they examine trading activity alongside price movement. Rising volume during a price advance can show broader participation, while a move on declining volume may have less support. Use volume as context, not as a standalone direction signal.
Indicator Accuracy and Trading Signals
How accurate are market momentum indicators and trading signals? They apply defined calculations to past and current price data, but no reading tells you what price will do next. Accuracy depends on the indicator, timeframe, market conditions, and how you interpret the signal alongside price direction and volume. What are the risks of trading based on market momentum software? Fast reversals, false crosses, and lagging readings can lead to poorly timed decisions. A signal alone doesn’t account for risk or establish likely profit.
The Stochastic Momentum Index (SMI) measures the close’s position in the recent high-low range on a scale from -100 to +100. A close at the range midpoint registers zero; a close at the top registers +100, and one at the bottom registers -100. This gives a normalized view of where price sits within its recent range.
RSI interpretation can also reflect market phase. The Nule Cardwell RSI guide treats readings above 60 as bullish, readings from 40-60 as lateral, and readings below 40 as bearish. It identifies 40 as support in a bullish phase and 60 as resistance in a bearish phase. Comparing these levels with price structure can help separate a phase shift from a brief oscillator move.
Momentum trading definition and price trends
Momentum trading focuses on an asset’s recent price movement, using its direction and pace to frame a trading strategy. A basic momentum value is the current price minus the price at a specified earlier point. If a stock was priced at $100 a month ago and is $120 today, its momentum value is 20. The calculation measures change, not the reason behind it or the next move.
Lookback period shapes the result. To calculate SPY’s 10-day momentum, subtract its closing price 10 days earlier from its closing price today. A positive result means the current close is higher; a negative result means it is lower. Traders can compare that reading with the asset’s price trend, then assess whether the move is gaining strength or losing pace.
Trading strategies also differ by holding period. Momentum positions may be held for days or weeks, while day-trading positions last for hours. Short-term momentum approaches use periods from minutes to days; long-term approaches span months to years. The timeframe changes what a price move means: a brief surge may matter to a short-term trader but barely affect a longer-term trend.
Time-series momentum evaluates an asset against its own historical performance. A strategy may set a profit threshold over a lookback period such as 3, 6, or 12 months. For example, a stock gaining more than 10% over the past 6 months may trigger a buy signal in one approach. The threshold defines the rule; it does not explain whether the gain came from sustained demand, a temporary event, or broader market conditions.
Cross-sectional momentum compares assets with one another. A strategy can rank stocks by their returns over the past 3 months, then focus on stronger relative performers. One approach described for this method buys the top 10 performers. Rankings shift as prices change, so the output depends on the selected universe, measurement period, and ranking rule. Comparing relative performance can reveal leadership that a single-stock chart may not show.
For clearer interpretation, keep the measurement period consistent with the intended holding horizon. Compare price direction with the calculated momentum, then note whether the asset is outperforming its peers or moving with the broader market. A World Indices Bubble Map can provide a visual view of index movement alongside individual-asset analysis. Momentum readings describe past price changes; the trading strategy determines how those readings are used.
Identifying momentum ignition
Momentum ignition is a shift from muted price movement to a faster, more directional move. To identify a possible transition, compare recent price action with its earlier range, then look for stronger follow-through instead of relying on a single abrupt candle. A breakout with rising volatility can signal a change in activity, but volatility alone doesn’t establish sustained buying or selling pressure.
Start with price structure. Note whether an asset has moved beyond a recent range, then check whether subsequent closes continue in the same direction. For example, a move above resistance followed by another strong close offers more evidence of continuing strength than an intraday spike that reverses before the close. The chart timeframe matters: a brief jump may dominate a minute chart while barely changing a longer-term view.
Momentum tools can help describe this transition in different ways. The Phase Oscillator Momentum Strategy uses readings of ±100 as trigger levels. Treat a threshold crossing as a point for closer examination, then compare it with price behavior and the intended trading horizon. The Signed Excursion Recovery Oscillator displays retained and surrendered movement in ATR units known at the starting close. That view helps distinguish a move that holds gains from one that gives back much of its initial advance.
Look for agreement across evidence rather than relying on a single ignition signal:
- Price: Check whether closes extend beyond the prior range or quickly return inside it.
- Strength: Compare the move’s direction and follow-through with the asset’s recent structure.
- Volatility: Note whether price movements become wider as the move develops.
- Position: Define the level that would invalidate the setup before acting on a signal.
These checks help distinguish a developing trend from an isolated burst. If an asset breaks upward but closes back within its earlier range, the breakout hasn’t held. If price keeps advancing and retains more of its gains, the evidence for persistent strength is clearer. The same logic applies to downward moves, with selling pressure and surrendered gains assessed in the opposite direction.
Include risk management in the analysis, not as an afterthought. Short-term momentum trading calls for tight stop-loss orders, precise timing, and disciplined risk management. A volatile move can quickly change the distance between an entry and an invalidation level, so position size should reflect that exposure. To navigate sudden turbulence and guard against significant drawdowns, tools like Alpha Shield offer specialized market signals that complement momentum indicators. Price alerts can help track a chosen level, but an alert reports a condition; it doesn’t tell you whether the trend remains valid.
Software can bring price, volatility, and indicator readings into one view, making them easier to compare across timeframes. Use that display to see whether price action confirms an ignition signal, then reassess when the structure changes. A trigger identifies a condition to examine, not a complete trading decision.
Moving average systems for momentum identification
A moving average smooths price movements across a selected number of periods, making trend direction easier to inspect. A fast average responds sooner to recent changes, while a slow average filters more short-term fluctuation. A sample momentum system compares a 10-day fast moving average with a 50-day slow moving average. Their relationship offers a structured view of changing momentum.
When the 10-day average crosses above the 50-day average, the faster price trend has strengthened relative to the slower one. A cross below shows the opposite relationship. Traders often treat these crossings as signals to examine, not automatic instructions. The averages summarize past prices, so a crossover can appear after a substantial move has already developed.
Period choice should match the analysis horizon. Momentum traders may use 9-period and 21-period exponential moving averages to assess short-term movements. Exponential averages give greater weight to recent prices, so they respond faster than simple averages. For longer-term trend identification, a 50-period simple moving average and a 200-period simple moving average provide broader reference lines.
Moving-average patterns add context beyond a single cross. If both averages slope upward and the faster line stays above the slower line, the displayed trend is rising. If the lines flatten, momentum may be weakening. When the lines move farther apart, the trend differs more across those periods; when they converge, the gap between short-term and longer-term direction is narrowing.
- Cross: Compare the fast and slow lines for a change in their relative position.
- Slope: Check whether each average is rising, falling, or flattening.
- Price distance: Observe whether current price movements are extending away from the average or returning toward it.
- Timeframe: Match the chart’s periods to the trend you’re evaluating.
These checks help distinguish a clear trend from a brief price fluctuation. For example, a fast-line cross above a slow line followed by upward slopes in both averages is a different pattern from a cross while both lines remain flat. The latter shows less alignment between short-term movement and broader direction. Read the average alongside price structure, not in isolation.
Moving-average systems can help clarify the trend conditions behind a strategy, but they don’t determine position size or risk limits. Those depend on the trading plan. Review the chosen periods consistently, because changing them alters how quickly the system responds. A shorter average reacts faster, while a longer average generally smooths more movement.
Software that plots multiple averages makes crosses, slopes, and separation visible on one chart. Use it to compare patterns across assets or timeframes, then note whether price confirms the trend indicated by the averages. A moving average is a lagging summary, not a forecast; it makes historical direction and changing relationships easier to examine.
How do I set up a momentum scanner for stocks?
Build a stock scanner around a clear comparison rule: define the stocks to scan, the measurement period, and the condition that puts a stock on the results list. A time-series approach compares each stock with its own past performance. A cross-sectional approach ranks stocks against one another. These methods answer different questions, so choose one before adding filters.
For a time-series momentum example, set a gain threshold and lookback period. A stock gaining more than 10% over the past 6 months may trigger a buy signal in the example strategy. Treat that rule as a way to narrow results, not as a complete trading decision. Examine whether price action and the broader trend support the scanner result.
Set up the scan by defining its inputs in order:
- Choose the universe: Select the stocks you want to compare, such as a defined market or industry group.
- Set the lookback: Use the period that matches the strategy. A cross-sectional example ranks returns over the past 3 months.
- Choose the rule: Filter for a specified return or rank stocks by performance.
- Review results: Compare the strongest candidates with their price charts and trend context.
A cross-sectional scan ranks each selected stock by its return over the past 3 months. This highlights relative performers within the chosen universe. The ranking changes as prices move, and the output depends on which stocks the scan includes. If the universe changes, the same stock may rank differently, even when its own return remains unchanged.
Keep the scan’s purpose consistent with its inputs. A 6-month threshold describes performance over that period; it does not identify the timing or cause of each price move. Use filters to organize candidates, then inspect whether the trend remains intact. Avoid adding conditions without a reason, because each extra rule changes which stocks appear and what the results represent.
Historical testing can show how a scanner’s rules behaved across different market conditions. Comprehensive backtesting guidance recommends at least 10 years of daily historical data. For intraday strategies, accurate backtesting requires tick-by-tick or minute-by-minute historical data. The data interval should match the scanner’s intended use; daily records cannot capture every intraday price movement.
After applying a stock momentum rule, compare the resulting names visually rather than relying on rank alone. A Stock Market Bubble Map helps you view stock movement across the market. Use that view alongside the scanner’s chosen lookback and return criteria to examine where momentum is concentrated.
BubbleMarkets: Free Live Market Bubble Maps
BubbleMarkets gives you a visual way to scan market movement after you’ve defined momentum through price, indicators, or a scanner. Its Free Live Market Bubble Maps help you compare asset performance across a market view, while the Stock Market Bubble Map and Crypto Bubble Map focus on those respective asset groups. Use these maps when you want to see where movement is concentrated, then return to individual charts to examine price behavior and moving-average patterns. Pro, Professional, and Enterprise Subscriptions provide additional access options for readers who need more than the free visualizers. Bubble maps complement momentum analysis; they don’t replace a strategy or make trading decisions for you. Explore the maps and platform details at BubbleMarkets.
Make Your Momentum Review Repeatable
Turn chart observations into a consistent review process. Choose software to identify market momentum that lets you compare the same assets, timeframes, and conditions each time you review them. Record what would strengthen or weaken your interpretation before a price move develops. That gives each signal a defined context and makes changes in your analysis easier to track.
Keep the process practical: focus on useful information, remove displays that distract, and revisit your criteria as your goals change. BubbleMarkets offers market visualization tools for examining asset movement in a shared view. The right setup should support your analysis, not replace it.
Contact BubbleMarkets to discuss your needs and explore a workflow that fits your market research. Take the next step at your own pace, with a clearer view of what you want to monitor.
Frequently Asked Questions
How Is It Calculated?
Basic momentum equals the current price minus the price at a selected earlier point. To compare assets with different price levels, express the change relative to the earlier price. Use the same measurement interval for each asset to keep comparisons meaningful. A scanner can sort or filter results by that measure, helping you identify which securities moved most during the selected period.
What Trading Software to Use?
Choose software based on the markets you follow and how you examine price movement. Software to identify market momentum should make comparisons and relevant market data easy to inspect without presenting a chart as a trading instruction. BubbleMarkets provides visual market maps and screeners for reviewing asset movement. Its tools support analysis; they don’t execute trades or provide personalized investment recommendations.
What software tools identify market momentum in stocks, forex, and crypto?
Choose a platform that covers the asset classes you want to compare. BubbleMarkets offers stock, forex, and crypto bubble maps, along with market screeners and heat maps. A shared visual approach can help you scan different groups, while each market map keeps its assets in view. Compare the displayed movement with the relevant asset’s chart before interpreting a pattern across markets.
What indicators do market momentum scanners use?
Common scanner inputs include price change over a selected lookback period, moving-average relationships, RSI, MACD, and trading volume. Check whether a scanner applies indicators as filters, displays their readings, or ranks assets by results. For instance, a filter can narrow a watchlist to securities meeting a chosen condition, while sorting lets you inspect stronger readings first.
What are the best stock momentum scanners for day traders?
Choose a scanner that supports the intraday timeframe and stock universe in your trading plan. Check whether its data interval matches the speed of the price movements you want to assess and whether its filters can be combined without hiding relevant candidates. Test the rules against historical data at the same level of detail you intend to use. For intraday testing, minute-by-minute or tick-by-tick data is required for accuracy.
Which market momentum software offers real-time data and alerts?
BubbleMarkets offers price alerts with Pro, Professional, and Enterprise subscriptions. Its free maps refresh prices every 1-2 minutes, while Pro refreshes every 30-60 seconds. Second-to-second live streaming is available only with Professional and Enterprise subscriptions. Crypto and forex data update continuously; stocks, ETFs, commodities, bonds, and indices update while their markets are open. Match the update cadence to what you monitor.
How much do popular market momentum analysis tools cost?
Costs vary by tool, access level, and included features. Some platforms provide free market views, while subscriptions may add analytical tools; API access and commercial licensing may have separate terms. BubbleMarkets offers free maps and Pro, Professional, and Enterprise subscriptions. Compare the features you’ll use, such as market coverage or alerts, with the plan details before choosing a paid option.
What free software can identify market momentum?
BubbleMarkets’ Free Live Market Bubble Maps let you view market maps without creating an account. The free maps cover stocks, ETFs, forex, and crypto, giving you a visual way to scan asset movement. Use them to identify areas worth examining, then assess individual assets using your own chart criteria. Viewing the maps is free, and no sign-up is required.
Frequently asked questions
How Is It Calculated?
Basic momentum equals the current price minus the price at a selected earlier point. To compare assets with different price levels, express the change relative to the earlier price. Use the same measurement interval for each asset to keep comparisons meaningful. A scanner can sort or filter results by that measure, helping you identify which securities moved most during the selected period.
What Trading Software to Use?
Choose software based on the markets you follow and how you examine price movement. Software to identify market momentum should make comparisons and relevant market data easy to inspect without presenting a chart as a trading instruction. BubbleMarkets provides visual market maps and screeners for reviewing asset movement. Its tools support analysis; they don’t execute trades or provide personalized investment recommendations.
What software tools identify market momentum in stocks, forex, and crypto?
Choose a platform that covers the asset classes you want to compare. BubbleMarkets offers stock, forex, and crypto bubble maps, along with market screeners and heat maps. A shared visual approach can help you scan different groups, while each market map keeps its assets in view. Compare the displayed movement with the relevant asset’s chart before interpreting a pattern across markets.
What indicators do market momentum scanners use?
Common scanner inputs include price change over a selected lookback period, moving-average relationships, RSI, MACD, and trading volume. Check whether a scanner applies indicators as filters, displays their readings, or ranks assets by results. For instance, a filter can narrow a watchlist to securities meeting a chosen condition, while sorting lets you inspect stronger readings first.
What are the best stock momentum scanners for day traders?
Choose a scanner that supports the intraday timeframe and stock universe in your trading plan. Check whether its data interval matches the speed of the price movements you want to assess and whether its filters can be combined without hiding relevant candidates. Test the rules against historical data at the same level of detail you intend to use. For intraday testing, minute-by-minute or tick-by-tick data is required for accuracy.
Which market momentum software offers real-time data and alerts?
BubbleMarkets offers price alerts with Pro, Professional, and Enterprise subscriptions. Its free maps refresh prices every 1–2 minutes, while Pro refreshes every 30–60 seconds. Second-to-second live streaming is available only with Professional and Enterprise subscriptions. Crypto and forex data update continuously; stocks, ETFs, commodities, bonds, and indices update while their markets are open. Match the update cadence to what you monitor.
How much do popular market momentum analysis tools cost?
Costs vary by tool, access level, and included features. Some platforms provide free market views, while subscriptions may add analytical tools; API access and commercial licensing may have separate terms. BubbleMarkets offers free maps and Pro, Professional, and Enterprise subscriptions. Compare the features you’ll use, such as market coverage or alerts, with the plan details before choosing a paid option.
What free software can identify market momentum?
BubbleMarkets’ Free Live Market Bubble Maps let you view market maps without creating an account. The free maps cover stocks, ETFs, forex, and crypto, giving you a visual way to scan asset movement. Use them to identify areas worth examining, then assess individual assets using your own chart criteria. Viewing the maps is free, and no sign-up is required.
Market information on this page is for education and general information only. It is not investment advice or a recommendation to buy or sell any asset.