 BubbleMarkets
Emotional Cycle of the Market Visualizer: Understand Each Phase

Market peaks and troughs can reflect shifts in investor emotion as well as changes in prices. The emotional cycle of the market visualizer maps a typical progression from hope and optimism to euphoria, then through anxiety, denial, panic, and depression. These phases describe common reactions, not a timetable or forecast.
Fear and excitement are easy to recognize after a market move, but harder to spot as they shape decisions during a cycle. Behavioral finance links psychology and economics to explain patterns such as chasing returns, ignoring evidence, and panicking during declines.
This guide explains what each phase can look like, how sentiment may shift as a cycle turns, and why the same market move can prompt different reactions. It also shows how to read an emotional-cycle visualizer as a framework for interpreting behavior, not a signal that predicts what prices will do next.
Key Takeaways
- Use behavioral finance to recognize how emotions and cognitive biases can shape choices during changing market conditions.
- Look for complacency as a possible sign that confidence is persisting even while a downturn begins to emerge.
- Distinguish anxiety from denial by noticing whether investors are responding to warning signs or explaining them away.
- Understand how despair and capitulation can affect decisions, without treating either phase as a reliable signal of a market bottom.
- Read the cycle as a framework for interpreting sentiment, then compare it with market data rather than relying on emotion alone.
Behavioural finance and investor behaviour
What are the risks of making investment decisions based on market sentiment charts? Investors may mistake crowd mood for evidence, react too late, or treat a chart as a forecast. Sentiment displays describe behavior; they do not establish what prices will do next.
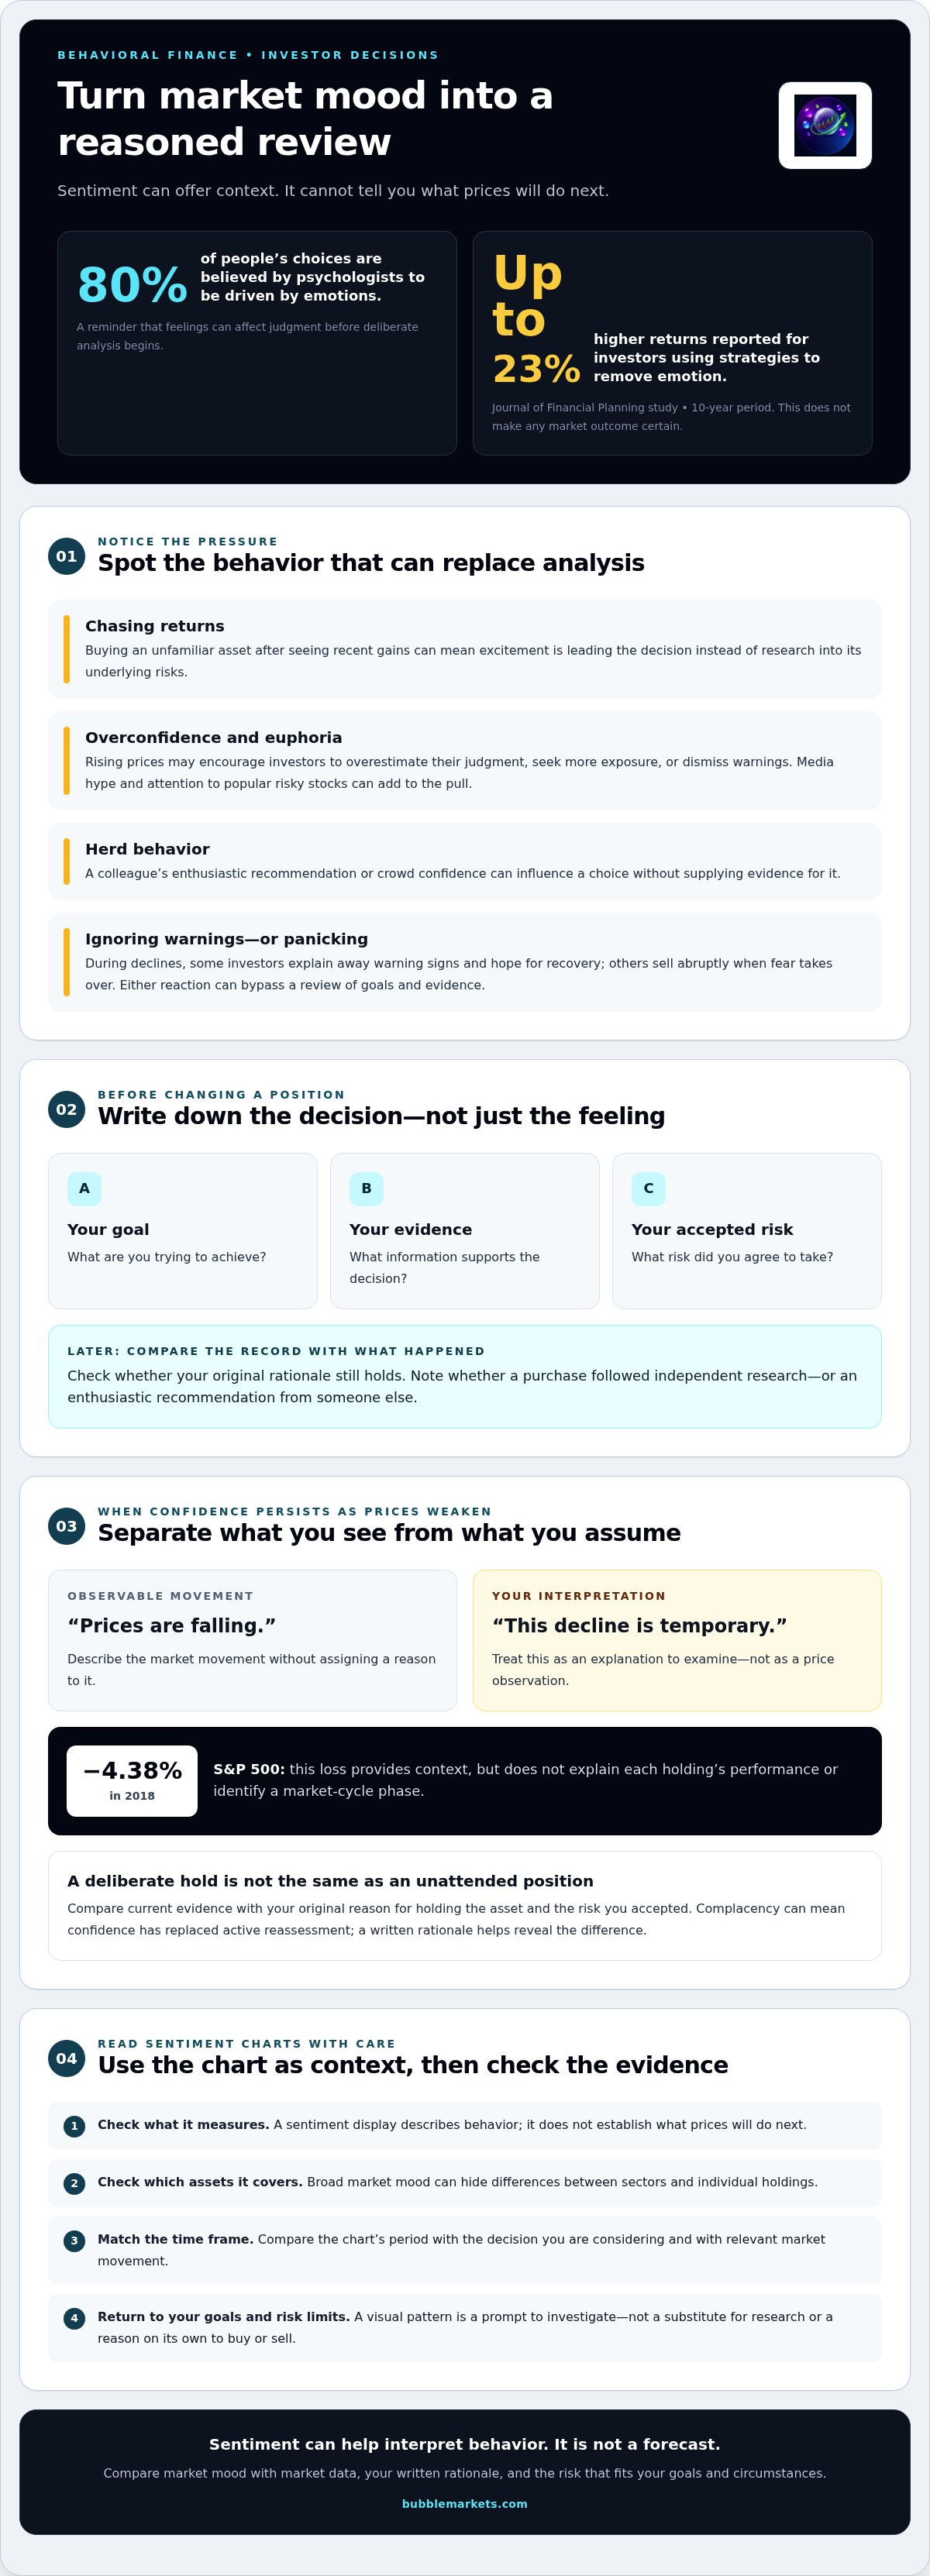
Behavioural finance combines psychology and economics to explain choices across market cycles. Behavioural science examines cognitive biases that can influence those choices. The concepts help explain why an investor might chase returns during a rally, then panic during a decline. Psychologists believe emotions drive 80% of people’s choices, a reminder that feeling can affect judgment before deliberate analysis begins.
That influence can show up as overconfidence. During the thrill phase, rising prices may lead investors to overestimate their ability to judge risk. Someone might buy an unfamiliar asset after seeing its recent gains, without researching its underlying risks. Investing without proper research, media hype, and attention to popular risky stocks are signs associated with euphoria. Each can encourage decisions driven by excitement rather than evidence.
Start by recording the reason for a decision. Before changing a position, write down your goal, the evidence you considered, and the risk you accepted. Later, compare your original rationale with what happened. For example, note whether a purchase followed independent research or an enthusiastic recommendation from a colleague. This record helps distinguish a considered choice from a reaction to headlines or group behavior.
Confidence can also rise with market prices. New gains may prompt investors to seek more exposure or dismiss warnings, even when their original risk tolerance hasn’t changed. A Journal of Financial Planning study found that investors using strategies to remove emotion saw returns up to 23% higher over a 10-year period. That finding supports disciplined processes; it doesn’t make any market outcome certain.
Declines can bring a different set of biases. Some investors ignore warning signs or hold an asset while hoping for a recovery. Others sell abruptly when fear takes over. Both reactions can bypass a review of goals, evidence, and the original reasons for holding an investment. Independent research and skepticism about herd behavior can help prevent social pressure from replacing analysis.
Life stage affects an investor’s risk threshold. Someone approaching retirement may prioritize capital preservation and reassess whether their strategy fits future needs. Someone with a longer horizon may view market declines differently, while still respecting their financial comfort zone. The practical test is whether the risk fits the investor’s goals and circumstances, not whether the crowd seems confident.
Use sentiment charts as context, then compare their message with other information. Check what the display measures, which assets it covers, and whether its time frame matches the decision at hand. A broad market mood can hide differences between sectors or individual holdings. Treat a visual pattern as a prompt to investigate, not a substitute for research, risk limits, or a written rationale.
Complacency as downturns begin
Complacency can emerge after euphoria fades, as early signs of a downturn appear. In a typical market cycle, confidence may remain high even as prices weaken. Investors might dismiss a brief decline as temporary and expect the previous upward trend to resume. This mismatch matters: sentiment can lag behind changing market conditions. A chart may show a shift in mood, but cannot establish why prices moved or what comes next.
Consider an investor whose holdings rose during a strong rally. When prices retreat, they might dismiss the change as ordinary fluctuation and make no review. Complacency is not simply calm behavior; it can mean confidence has replaced active reassessment. The key distinction is between a deliberate decision to hold and an unchanged position left unattended. A written investment rationale makes that difference easier to examine.
Separate observable market movement from your interpretation. Note whether prices are rising or falling, then record the explanation you assign to that movement. For example, “this decline is temporary” is an interpretation, not a price observation. Compare it with your original reason for holding the asset and the risk you accepted. This simple distinction can reveal when optimism is shaping your reading of market evidence.
Complacency can also affect attention. Investors may focus on familiar holdings while overlooking changes elsewhere in a market. Compare broad index movement with the assets or sectors relevant to your portfolio. The S&P 500 lost 4.38% in 2018, but that figure alone doesn’t explain each holding’s performance or identify a cycle phase. A single index provides context, not a complete account of market conditions.
Follow a consistent review process instead of reacting to one visual change. Check the chart’s time frame, compare the same period across relevant assets, and ask whether the evidence challenges your original assumptions. A market heat map can display relative movement across categories, while a sentiment chart focuses on perceived mood. Neither replaces an examination of the information underlying an investment.
For a broader view, compare sentiment with market movement across asset categories. Keep the purpose narrow: identify whether confidence appears out of step with observed conditions, then return to your goals and risk limits. A visualizer is most useful as a prompt for review, not a reason to buy or sell. In the cycle, complacency marks a possible transition, not a dependable turning-point signal.
Anxiety and denial during declines
As prices fall, anxiety can make each new decline feel like evidence of greater danger. Investors may watch daily movements closely but struggle to distinguish a sharp fluctuation from a change in their original investment case. For example, someone holding a company’s shares might see every red trading day as confirmation that further losses are coming. The emotional response is real, but it does not explain the cause of the price change.
Denial can follow as a way of coping with a faltering market. An investor might hold an asset in hope of a recovery, even as warning signs accumulate. That differs from a deliberate decision to retain an investment after reviewing its fundamentals, time horizon, and risk. The distinction matters: hope alone cannot test whether the original reasons for holding still apply.
To examine a decline, separate three things: the observed market move, your explanation for it, and the decision you are considering. A chart may show a downward trend, but it cannot establish whether a company’s prospects have changed. Review relevant information, then compare it with the assumptions behind the investment. This process helps reveal whether fear or denial is dominating your interpretation.
Ignoring warning signs during anxiety can lead to greater losses. Consider an investor who sees a holding fall, dismisses relevant new information, and makes no review. If the underlying case has weakened, waiting without reassessment leaves that risk unexamined. Selling solely to stop feeling uncomfortable can also bypass analysis. A decision should address the asset and the investor’s goals, not just the immediate feeling prompted by a falling price.
A market sentiment chart can put individual reactions alongside broader shifts in mood. Read its labels and time frame first. Then compare the sentiment shown with observed market movement and relevant information about the assets involved. If a chart shows rising fear while one holding remains stable, investigate the difference. It is not proof that the holding is safe or at risk.
Keep a decision record during declines: write down the date, evidence reviewed, original rationale, and action taken. Later, compare the decision with your notes. For example, the record can show whether an investor sold after an outlook changed or after reading a frightening headline. This does not remove emotion, but makes its influence easier to identify. Anxiety and denial describe possible responses, not instructions about what to buy or sell.
Despair and capitulation
In the depression phase, confidence is shattered and growth remains minimal as the market bottoms out. Investors may see little reason to expect improvement. Capitulation describes a forceful exit after prolonged pressure. For example, a holder sells an investment after repeated declines, hoping to stop further losses. The decision may reflect fear, changed circumstances, or both. The sale alone does not reveal which factor mattered most.
Panic can precede this stage. It is the most intense phase of a typical market cycle, when fear dominates and losses are realized. A sharp fall may prompt investors to sell immediately rather than review their reasons for holding. That sale turns a decline in value into a realized loss. This distinction matters when reviewing decisions: an asset’s market value and an investor’s completed transaction are different facts.
Despair can also reduce attention to new information. An investor who expects no recovery may stop examining company updates or broader market conditions. Another might avoid checking an account after losses. Both responses make it harder to assess whether the original investment case still holds. A concrete review starts with the asset, the reason for holding it, and any evidence that has changed since purchase.
Capitulation does not prove that a market has reached its low. A chart showing intense pessimism records sentiment, not the market’s next direction. For example, widespread selling may continue after one investor exits, or prices may stabilize while confidence remains weak. Treat each observation separately: note the price movement, identify the sentiment shown, and examine relevant information about the asset. None of these steps turns emotion into a forecast.
During depression, stability can gradually return, laying the foundation for another cycle. That change may be difficult to recognize while confidence remains low. Investors can compare current conditions with earlier assumptions instead of assuming past losses will reverse. Someone nearing retirement may focus on whether their risk still fits future needs. A longer-term investor may have different priorities, while still reviewing exposure and financial goals.
To make a capitulation decision more accountable, record the evidence and reason for acting. Note whether the choice follows a changed outlook, a financial need, or discomfort with falling prices. Later, compare that note with what was known at the time. This review can show whether the decision followed a defined plan or an emotional reaction. Despair describes a possible market mood; it does not prescribe an action.
Emotional phases of market cycles
A typical cycle moves from hope for recovery through euphoria, then into declining confidence and renewed stability. This sequence describes recurring sentiment patterns, not a schedule every market follows.
No single, universally recognized creator is credited with the market psychology cycle diagram. It is an educational model illustrating how investor sentiment can shift as markets rise and fall.
Investor Emotions Across Market Phases
The cycle maps common investor reactions onto changing market conditions, from cautious hope to widespread pessimism. It matters because the same price movement can prompt different decisions as expectations change. Early recovery may bring small, careful investments; rising optimism can attract new capital. Later, euphoria may encourage excessive confidence, while falling prices can bring fear, denial, and despair.
In a typical sequence, hope follows a downturn as signs of recovery appear. Optimism grows, new capital flows in, and prices rise. In the belief phase, investors seek opportunities and diversify. Thrill and euphoria may follow, with excessive cash entering markets and stories of newfound wealth spreading through the media. Euphoria is often associated with the late stage of a bull run, but cannot identify a peak on its own.
As confidence weakens, complacency may give way to anxiety and denial. Panic follows when fear dominates and investors realize losses. Depression brings shattered confidence and minimal growth as the market bottoms out. Stability can then return, creating conditions for another cycle. Real markets do not move through these labels in a neat, confirmed order; reactions can overlap across assets.
Using Emotional Cycle Charts Carefully
An emotional-cycle chart is a reference for interpreting sentiment, not a tool for timing trades. A phase label cannot confirm a market top, bottom, or future price direction. Before drawing conclusions, investors can compare the label with observed market movement, asset-specific information, and their existing goals.
To reduce the risk of mistiming, first identify what the chart represents and its time frame. Then compare its sentiment description with price behavior and relevant information about the asset. Treat “buy when despondent, sell when euphoric” as a market-cycle saying, not a rule. Someone using an emotional-cycle visualizer can ask whether crowd mood may be influencing their judgment, then assess the decision independently.
The practical takeaway: use the cycle to recognize possible emotional pressure, not to predict the next turn. Past performance does not necessarily guide future performance, so phase labels alone cannot establish what happens next.
BubbleMarkets: Free Live Market Bubble Maps
BubbleMarkets offers free live market bubble maps to compare activity visually across assets, rather than relying on sentiment alone. Use the Stock Market Bubble Map or Crypto Bubble Map to view the relevant market, then consider what the display does and does not tell you. These maps provide market context; they do not identify emotional phases or predict price direction.
For a broader view, compare visual evidence with your own research and investment goals. BubbleMarkets offers Pro, Professional, and Enterprise subscriptions for readers who want additional visualization tools and features. Its visual maps can complement an emotional-cycle chart, but serve a different purpose: one displays market data, while the other describes investor sentiment.
Visit bubblemarkets.com to explore the Free Live Market Bubble Maps.
Make Your Next Market Review More Deliberate
Use the emotional cycle of the market visualizer as a prompt to examine how sentiment shapes your interpretation, not as a timetable for action. Before your next review, decide what information to compare and which personal goals matter to that decision. A consistent method makes it easier to distinguish a change in market conditions from a change in confidence.
Keep the process practical: note the question you are trying to answer, compare relevant market data, and record what would cause you to revisit your view. The aim is not to remove uncertainty from investing. It is to make your reasoning visible, so a strong market mood does not quietly become your only evidence.
For a visual reference point during that review, contact BubbleMarkets. Bring a specific market or comparison question to the conversation, and use the information to support your own analysis. A clear process gives you a steadier starting point for whatever market conditions come next.
Frequently Asked Questions
What is the emotional cycle of the market chart?
The emotional cycle of the market visualizer is a conceptual chart connecting investor sentiment with changing market conditions. It helps readers recognize how expectations may shift during a cycle, from cautious optimism to fear and renewed confidence. Treat it as a framework for interpreting behavior, not a live measurement or price forecast. For example, a chart’s “euphoria” label cannot tell you whether a particular index has peaked.
What are the stages of the emotional cycle of the market?
A common sequence begins with hope, then moves through optimism, belief, thrill, and euphoria. As the market turns, complacency can lead to anxiety, denial, panic, capitulation, and depression. This sequence offers a vocabulary for discussing sentiment, not a fixed route every asset must follow. When examining a cycle, note which phases the chart includes; diagrams may group or label stages differently.
What emotions correspond to each stage of the market cycle?
Hope reflects cautious interest in recovery, while optimism and belief bring growing confidence. Thrill and euphoria can involve excitement and overconfidence. Complacency suggests confidence persists as conditions change; anxiety and denial reflect worry or resistance to negative evidence. Panic involves intense fear, capitulation a decision to exit, and depression low confidence. These labels describe common reactions, not every investor’s experience.
How can I find an interactive market psychology cycle visualizer?
Market psychology diagrams are commonly used as educational references; interactive market-data maps offer a separate view of asset movements. BubbleMarkets offers free live market bubble maps, which display market data rather than psychology-phase labels. Compare a map’s asset movements with a cycle diagram to explore how sentiment and observed conditions may differ. Keep the views distinct: neither establishes the market’s next direction.
How do market cycle stages relate to bull and bear markets?
Hope, optimism, and belief can accompany recovery and rising prices, while euphoria is often associated with a bull run’s later phase. Anxiety, denial, and panic can occur during falling markets; depression may appear as confidence remains low. These are possible relationships, not strict definitions of bull or bear markets. For instance, sentiment may remain optimistic as prices begin to weaken, so assess market movement separately.
Are there free market cycle visualizers for stocks and cryptocurrency?
BubbleMarkets provides free live bubble maps for stocks and cryptocurrency, viewable without an account. The maps visualize market activity, not emotional stages. Use them to compare asset movements, and consult a cycle diagram separately for sentiment context. For example, a stock map may show broad market movement, while the cycle model helps frame how investors could be reacting to changing conditions.
Frequently asked questions
What is the emotional cycle of the market chart?
The emotional cycle of the market visualizer is a conceptual chart connecting investor sentiment with changing market conditions. It helps readers recognize how expectations may shift during a cycle, from cautious optimism to fear and renewed confidence. Treat it as a framework for interpreting behavior, not a live measurement or price forecast. For example, a chart’s “euphoria” label cannot tell you whether a particular index has peaked.
What are the stages of the emotional cycle of the market?
A common sequence begins with hope, then moves through optimism, belief, thrill, and euphoria. As the market turns, complacency can lead to anxiety, denial, panic, capitulation, and depression. This sequence offers a vocabulary for discussing sentiment, not a fixed route every asset must follow. When examining a cycle, note which phases the chart includes; diagrams may group or label stages differently.
What emotions correspond to each stage of the market cycle?
Hope reflects cautious interest in recovery, while optimism and belief bring growing confidence. Thrill and euphoria can involve excitement and overconfidence. Complacency suggests confidence persists as conditions change; anxiety and denial reflect worry or resistance to negative evidence. Panic involves intense fear, capitulation a decision to exit, and depression low confidence. These labels describe common reactions, not every investor’s experience.
How can I find an interactive market psychology cycle visualizer?
Market psychology diagrams are commonly used as educational references; interactive market-data maps offer a separate view of asset movements. BubbleMarkets offers free live market bubble maps, which display market data rather than psychology-phase labels. Compare a map’s asset movements with a cycle diagram to explore how sentiment and observed conditions may differ. Keep the views distinct: neither establishes the market’s next direction.
How do market cycle stages relate to bull and bear markets?
Hope, optimism, and belief can accompany recovery and rising prices, while euphoria is often associated with a bull run’s later phase. Anxiety, denial, and panic can occur during falling markets; depression may appear as confidence remains low. These are possible relationships, not strict definitions of bull or bear markets. For instance, sentiment may remain optimistic as prices begin to weaken, so assess market movement separately.
Are there free market cycle visualizers for stocks and cryptocurrency?
BubbleMarkets provides free live bubble maps for stocks and cryptocurrency, viewable without an account. The maps visualize market activity, not emotional stages. Use them to compare asset movements, and consult a cycle diagram separately for sentiment context. For example, a stock map may show broad market movement, while the cycle model helps frame how investors could be reacting to changing conditions.
Market information on this page is for education and general information only. It is not investment advice or a recommendation to buy or sell any asset.